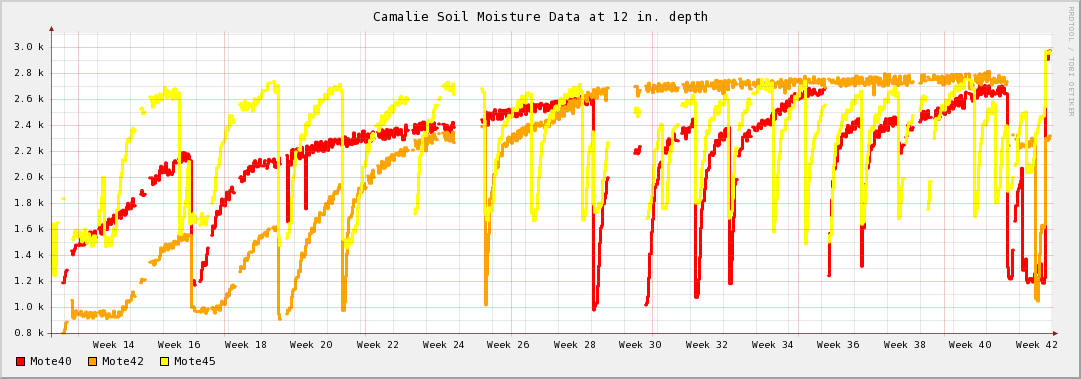
Below is a curve showing our soil moisture for the entire 2007 growing season. The data came from three locations in block 4 of the vineyard from soil moisture sensors located at 12" depth. Higher values are dryer. The low going spikes are irrigation events. You can see wet conditions initially in Week 12 and again after the first rains in week 41. All of these locations received the same irrigation yet you can see that the soil moistures were significantly different. The soil moisture sensors are located in close proximity to the outflow of a spaghetti hose connected to a dripper at a typical vine. All vines have these spaghetti hoses to 12" depth to reduce evaporation losses. Late in the season our expansive soils contract and crack every 6-12" which no doubt contributes to variability in the soil moisture transport and evaporation yet with enough sensors one can still get a clear enough picture to make irrigation decisions.
Our general approach was to use a pressure chamber to measure leaf water potentials and perform regulated deficit irrigation based on this data supplemented with soil moisture data. Once we achieved a desired leaf water potential in the -13 to -15 bar range we then used the soil moisture sensors to maintain the soil moisture at a constant level assuming that the soil moisture tension and the leaf water potential are directly related. We found this to be true to first order as we checked leaf water potentials periodically and compared them to soil moisture values. A formal correlation of he data is being compiled.
On 10/21/07 as our harvest wrapping up the ten 433MHz motes that had gathered soil moisture data so well throughout the 2007 growing season were taken out of service and replaced by ten second generation 2.4GHz motes provided by Crossbow Inc. The newer motes had been co-located in the vineyard for several months validating their firmware, range and base station/web server reliability were connected to the buried soil moisture sensors that the older network had been connected to.
Camalie Net was used during the 2005 and 2006 growing seasons to guide irrigation decisions in the 4.4 acres of Camalie Vineyards. Yield per vine in 2005 was double that of the 2004 yields for same age vines yet water consumption was constant. Water consumption normally goes up with canopy size which more than doubled for these 2.5 year old vines in 2005. Grape quality was excellent. Some of this success was due to generally better than average weather in 2005 but, we believe our visibility of the soil moisture played a significant role. Extra drippers were added to some areas of the vineyard based on the soil moisture data. Also irrigation intervals were shortened based on sensor data to reduce the amount of water that penetrated below the root zones where it would be wasted.
In 2006, the third year for our vines, the yields again doubled from 4 tons to 8 tons.
In the 4th year, 2007 the yield again doubled to 16 tons of fruit that was sold and another 1.5 ton that we made into wine ourselves. The yield was in excess of 4 tons per acre which is very rare of on Mt. Veeder especially in a year where water was tight due to less than half the normal rains in the winter of 06/07. Water had to be purchased but thanks to our precision irrigation we minimized water purchasing and maximized yields. Fruit quality was again excellent.
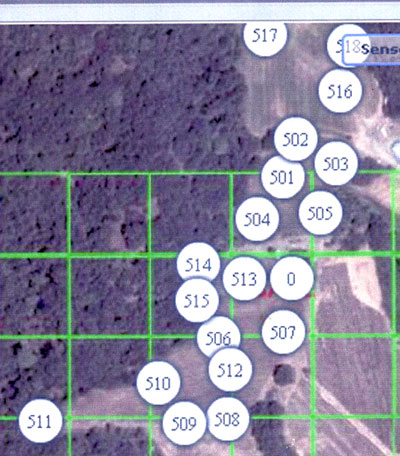
Below are the latest positions of the motes in our vineyard and the Strauss Schultheis vineyard. Nodes 513, 514 and 515 support fermentation monitoring. 514 and 515 are in the cave where the tanks are located and 513 is 50 ft. outside the doorway serving as a relay node to forward data to the garage attic 200 ft away where the base station is located. It is labeled mote 0.
Last Updated 11/2/07 M.H.